
Not another dashboard
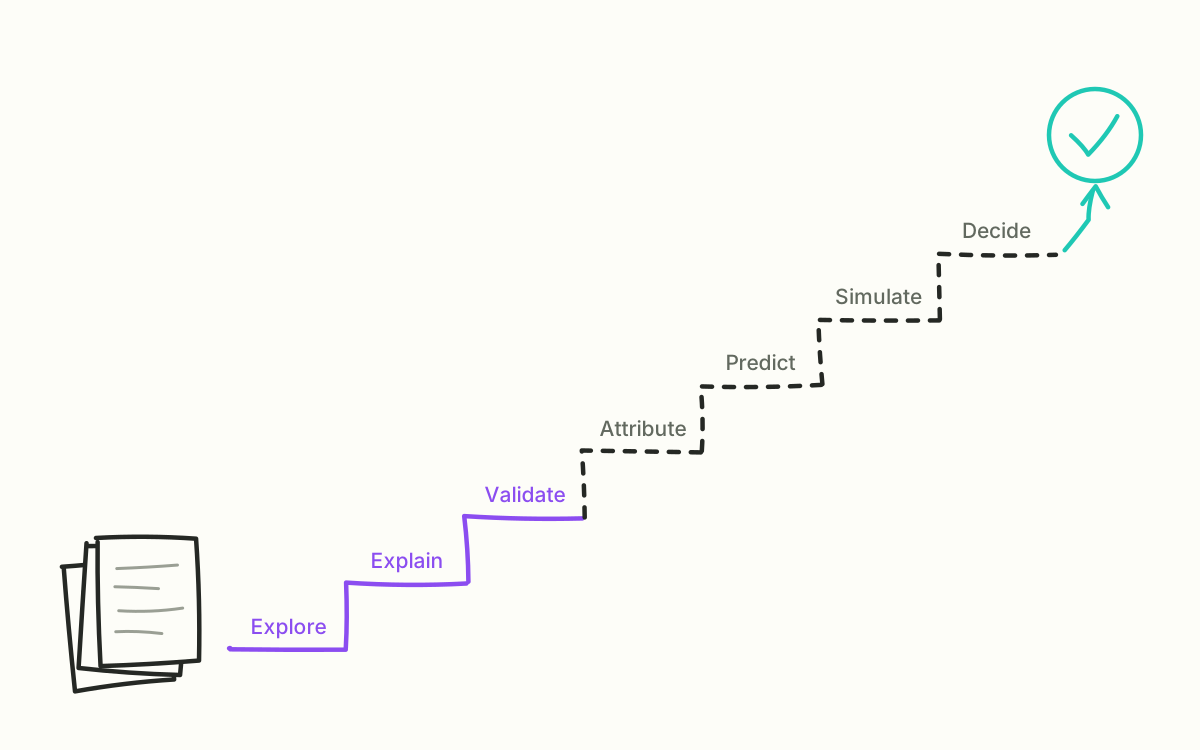
What Pythia is meant to be: seven stages from “What happened?” to “What do we do now?”.
Monday morning, purchasing meeting. March was weaker than last year, the autumn range needs ordering, and there are three reports on the table that agree on one thing: March was weaker than last year. None of them says why. And none of them says what to order now.
That is how almost every conversation about numbers in retail starts. The data is there – every receipt, every return, every credit note sits in the ERP. What is missing is the path from “this happened” to “this is what we do”. That is the path Pythia is meant to take.
Not a dashboard, but a tool for decisions
There are plenty of dashboards. They show what happened and stop where the real work begins. Pythia is meant to go further: understand sales, explore causes, check forecasts and, in the end, prepare a purchasing decision that people can follow.
The forecast is only one of several layers, not the goal. A number for next month is of little use if nobody knows how well the last numbers of that kind turned out – or which assumptions they rest on.
Seven stages from receipt to decision
We broke the goal down into seven stages. Each answers one question, and each builds on the one before:
- Explore – What happened? One central timeline from the year down to a single day, from the big picture down to a single item, always compared with last year or with what was expected.
- Explain – Why did it happen? Promotions, newsletters, price changes and weather appear as events with a lead-in and an after-effect, not as mere markers.
- Validate – Would the forecast have been right? Not applying today’s knowledge to old data, but asking: what would Pythia have predicted back then, with what it knew at the time?
- Attribute – What made the difference? Estimated contributions of individual factors to a jump in sales, explicitly as an estimate, not as proof.
- Predict – What will happen? The timeline reaches into the future, with a corridor instead of a single line and with the promotions already planned.
- Simulate – What if? Scenarios side by side, calculated through to revenue, contribution margin and stock coverage.
- Decide – What do we do now? Expected demand becomes a purchasing proposal, with its reasoning and with the risk of buying too little or too much.
The first stage needs no artificial intelligence. But it forces you to model sales, range and events so cleanly that every further stage can build on them.
Why the order matters
It would be tempting to start with the forecast. It sounds like the biggest win. But a forecast built on data nobody trusts is worse than none: it looks precise and isn’t. That is why Pythia starts at the bottom of the staircase – with the question of what actually happened, and with data that answers it reliably.
One element runs through every stage: every striking number should be able to explain itself. Click on an outlier and you should see what was expected, what actually happened and which circumstances came with it. Only then does a number become the basis for a conversation.
Next month: the first prototype – one CSV file, four reports and the realisation of how much was still missing.