
What normal looks like
The seasonal profile shows what to expect from a day – and the timeline now reaches into the future.
Up 20 per cent on last year. Good? It depends. If the business as a whole grew by 30 per cent, this period was rather weak. If last year was distorted by a one-off effect, the comparison may say nothing at all. A single previous year is a shaky yardstick.
This month Pythia learned what “normal” means.
The seasonal profile
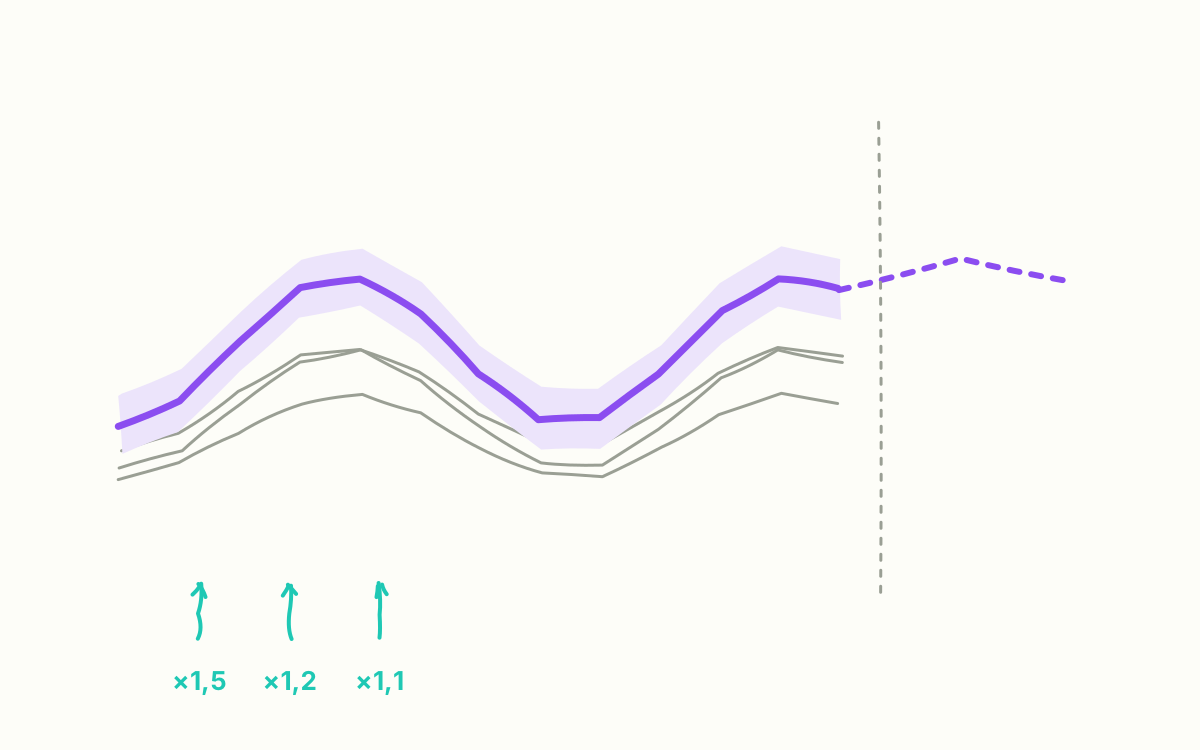
Instead of copying just one previous year, Pythia builds the expectation from several – up to five, three by default. Recent years count more than older ones: the weight halves with each year back. That keeps the expectation close to the present without depending on any one year.
The crucial part, though, is scaling. A previous year in which the business was only half as big is useful as a shape, not as a height. So Pythia scales every previous year up to today’s level.
The anchor
How does Pythia know how much bigger the business is today? From the eight weeks directly before the window being viewed. Those weeks are compared with the same weeks in each previous year. The ratio is the level factor by which that previous year is scaled.
The scaled previous years don’t lie exactly on top of each other afterwards. Their range becomes the corridor on the candle: if the actual lies inside it, the period was within what earlier years have shown too.
Normal isn’t last year. Normal is what recent years lead you to expect at today’s level.
Honest about its own limits
Every expectation comes with a note: which years were used, with which factor, and which were dropped.
Two cases get special attention:
- Build-up years: if a previous year was still in its build-up phase, its factor is very large. Such years are gradually down-weighted and stop counting beyond a certain factor. Otherwise a small early year would push the expectation up.
- Short anchor: if the window is much longer than the anchor – say a whole calendar year against eight weeks of off-season – Pythia says so and recommends looking at the simple year-on-year comparison alongside.
A look ahead
Because the expectation comes from the past, it can also be calculated for days that haven’t happened yet. So the timeline now extends beyond the last day of data. The key-figure tile separates the two cleanly: expectation up to today, and outlook for the rest of the window.
Next month: shopping weather – what rain does to sales.